System Usability Scale Analysis Toolkit

Fully web-based. Free & Open-Source. Secure & GDPR compliant.

The System Usability Scale Analysis Toolkit

Get insights & plots for your System Usability Scale study. Instantly!

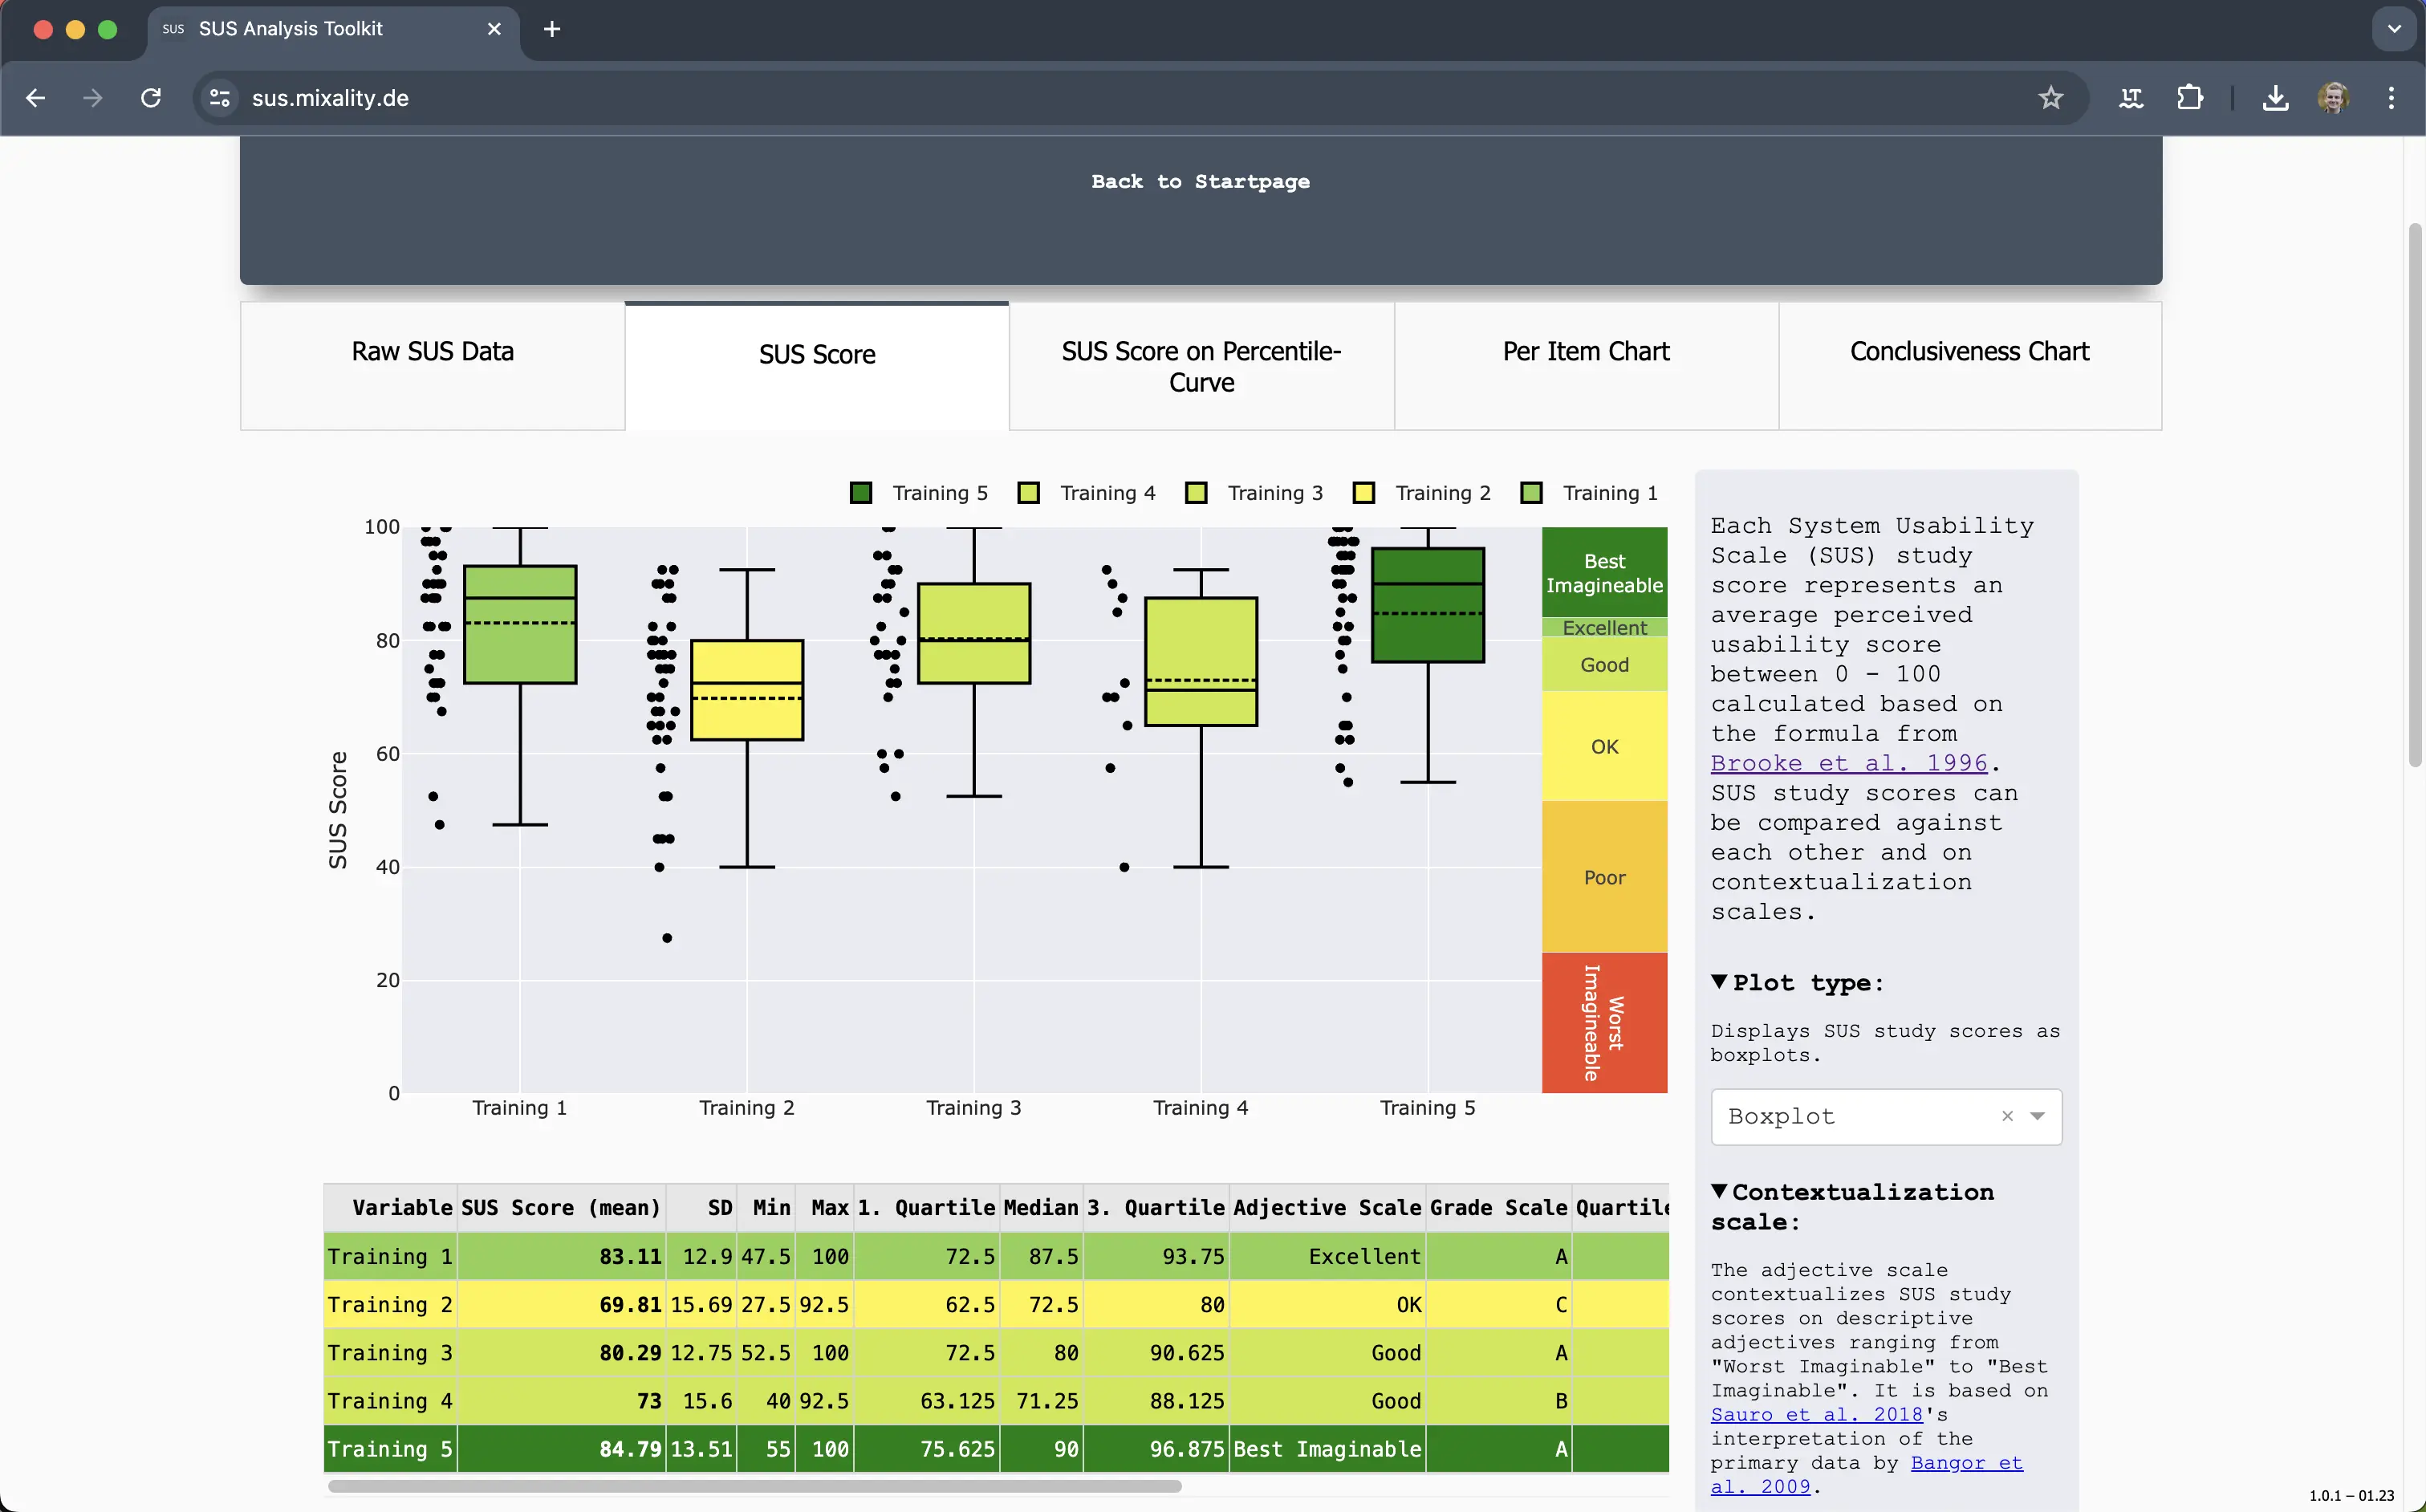
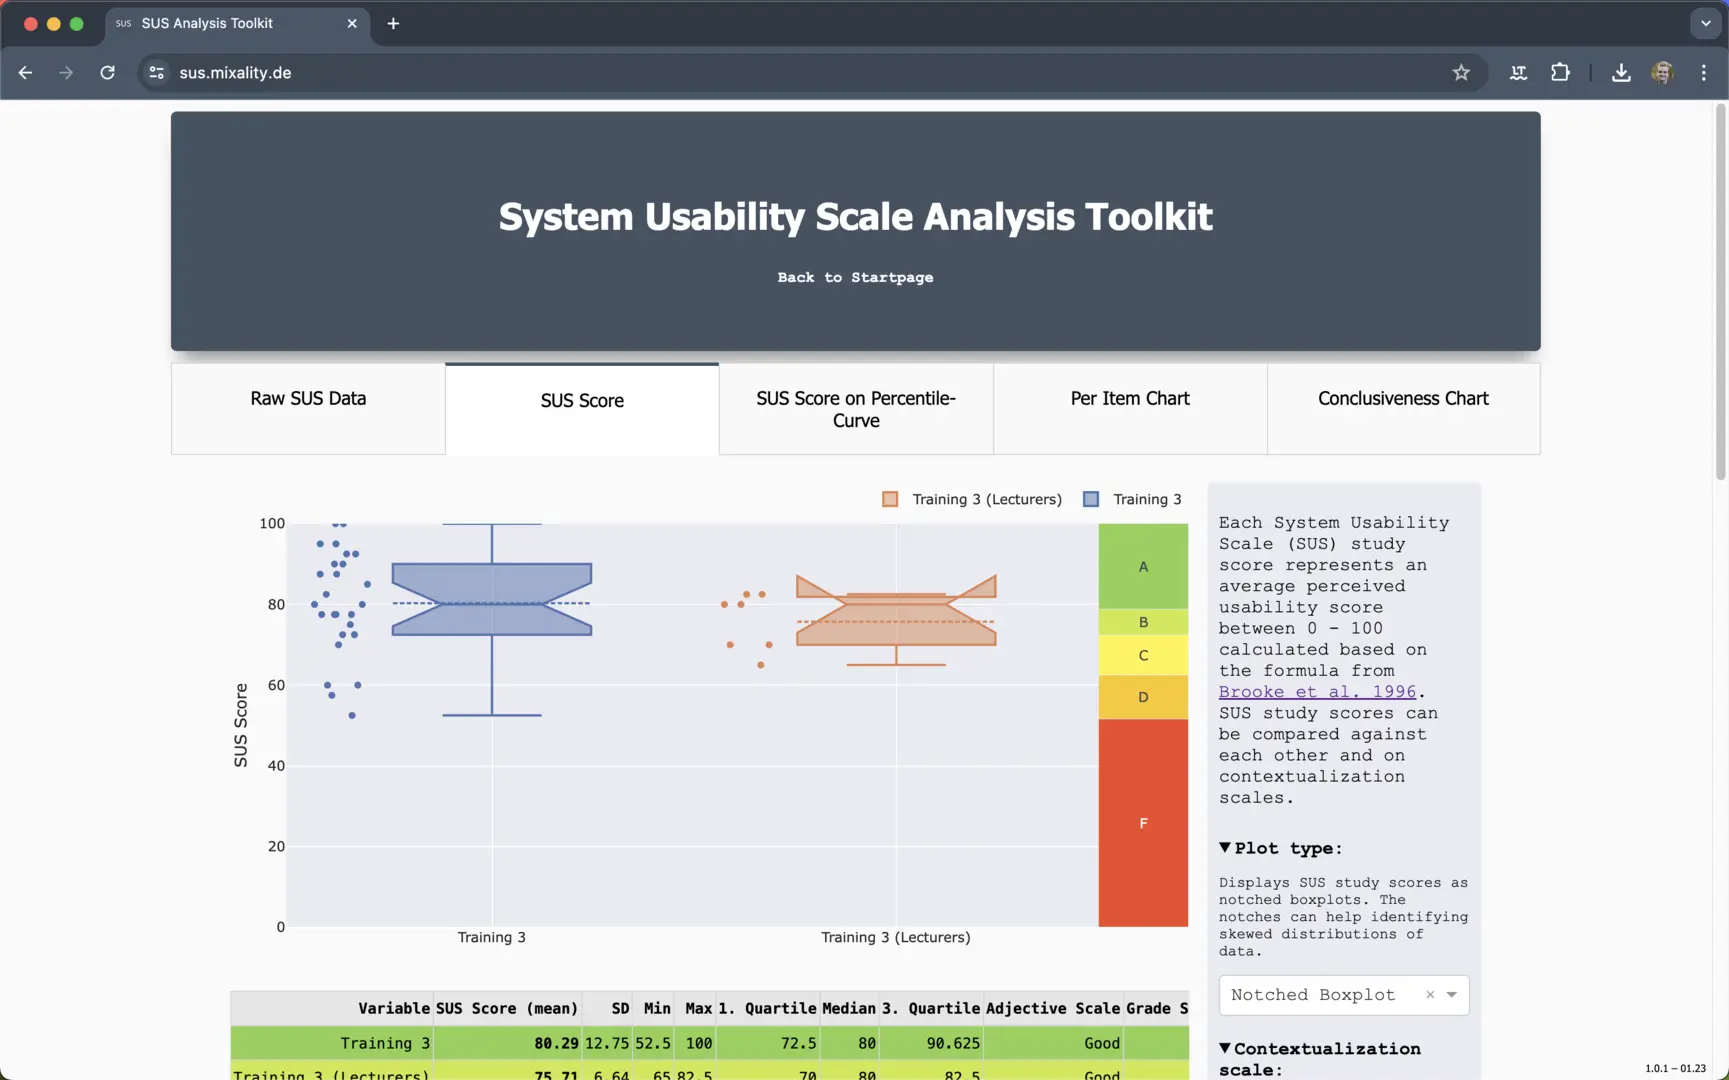
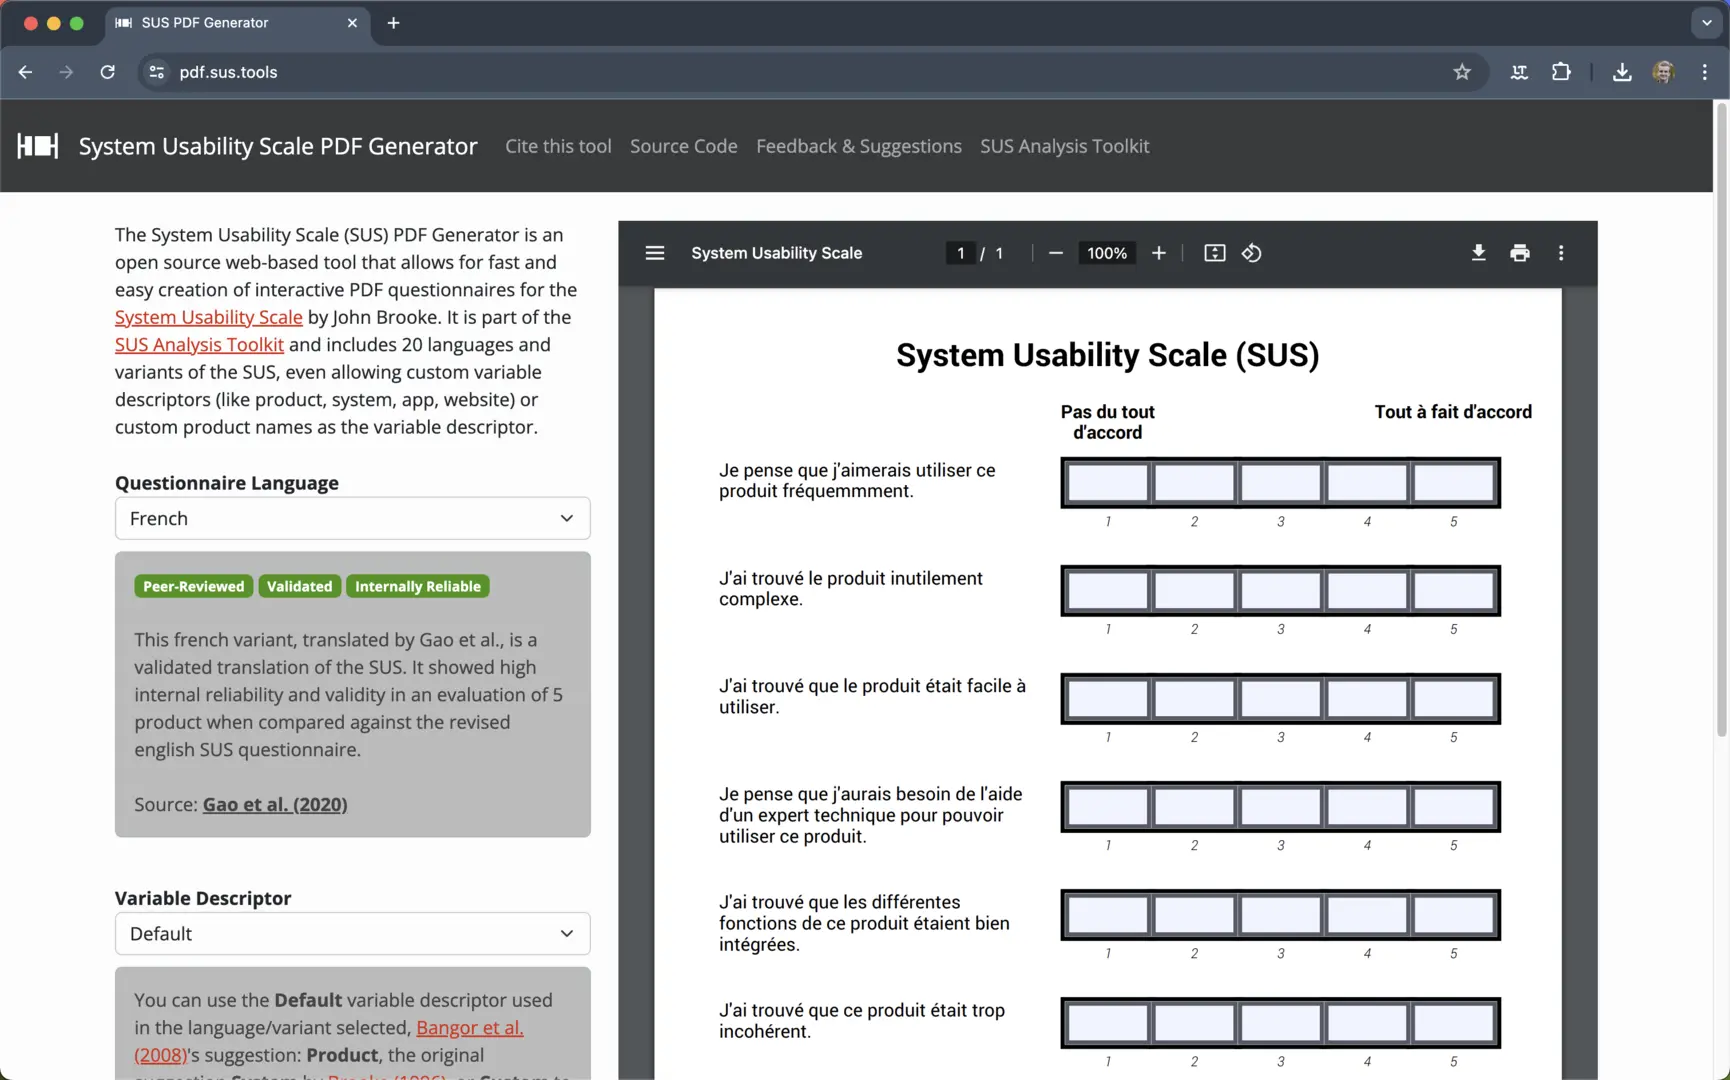
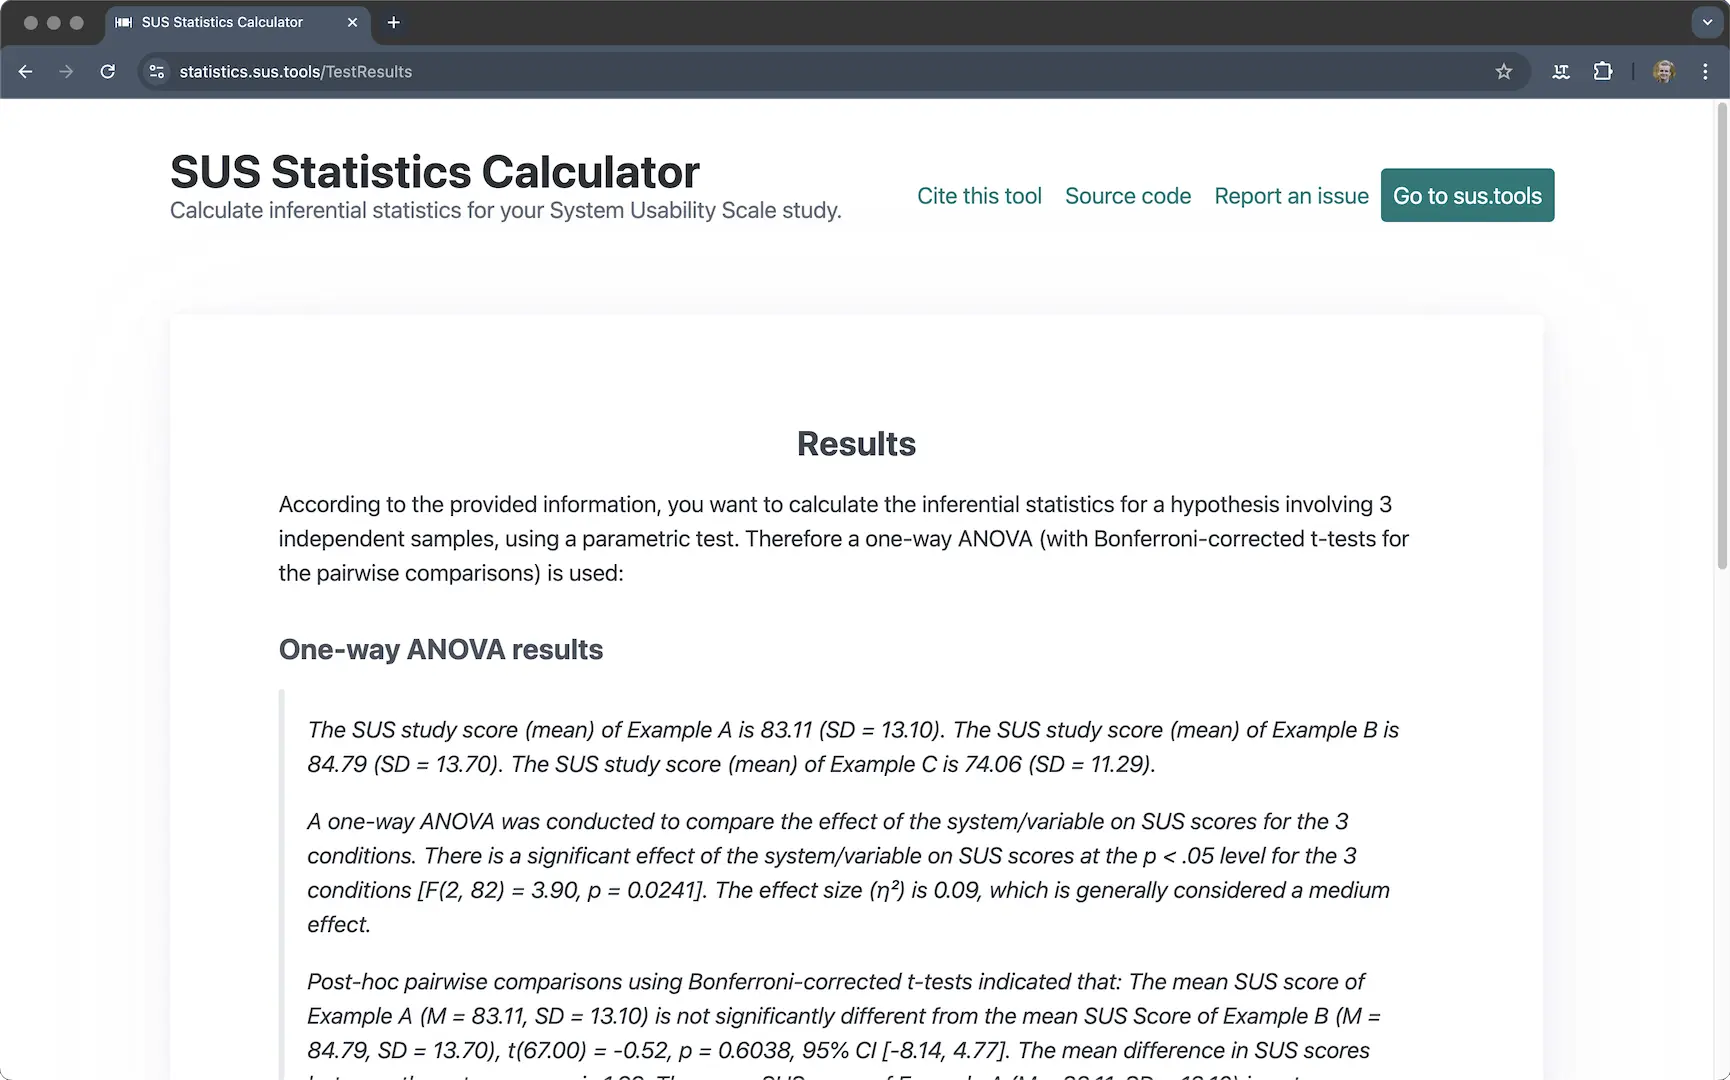
The open-source, web-based SUS analysis toolkit is the most comprehensive solution for deploying the System Usability Scale to date. It allows you to generate questionnaires for your study and calculate, analyze, plot, interpret, and contextualize SUS study results from any source — all for free.

Fully web-based.
No installation or registration required. The SUS Analysis toolkit workes out-of-the-box across platforms.
Free & Open-Source.
All parts of the toolkit are licened under the MIT license. Users own all calculations and figures created.
Secure & GDPR compliant.
No data is stored on our servers. Uploaded SUS data is only used for the calculations and figures.
Screenshot of analysis.sus.tools

Example uses cases for the SUS Analysis Toolkit

The System Usability Scale Analysis Toolkit is a versatile tool that can be used for a variety of use cases. Here are three common examples of how it could be applied to aid your SUS study.

Comparing the usability of
products or user groups

Imagine you have two products and you want to compare their perceived usability (within-subject comparison). Alternatively, you might have three different user groups (e.g., different personas) using the same product and want to evaluate their performance (between-subject comparison). First, you could export an SUS questionnaire in PDF format from pdf.sus.tools, conduct your study, and collect the raw results. Then, you upload the data as CSV files to analysis.sus.tools to instantly receive descriptive statistics, contextualized results, and camera-ready plots you can download. Finally, you can use statistics.sus.tools to calculate the inferential statistics to gather further insights.

Analysing iterative
usability developments

Let's say you have a single product and you want to analyze its usability over multiple iterations (a within-subject comparison). This approach is particularly useful for formative testing or continuous usability observation. If you already have a survey tool you are using, you could use pdf.sus.tools to select a variant/language of the SUS and simply transfer the questions to your survey tool. Conduct your study and collect the raw question scores after each iteration. Then, upload the dataset as a CSV file to analysis.sus.tools to instantly receive calculated SUS scores, descriptive statistics, contextualized results, and camera-ready plots you can download. Finally, you can use statistics.sus.tools to calculate the inferential statistics for further insights.

Quickly benchmarking
system usability

You might want to quickly benchmark the usability of a single product without having comparative data points or multiple iterations. This approach is ideal for obtaining a quick and dirty assessment of your product's perceived usability. First, you could use pdf.sus.tools to choose a variant/language of the SUS. Then, after conducting your usability study and collecting the raw SUS scores, you can upload the data as a CSV file to analysis.sus.tools (this time the "single variable analysis") to instantly receive the calculated SUS study score, contextualized against industry benchmarks and insights from previous research. This will provide you with descriptive statistics, a dashboard view of your product's performance, and camera-ready plots.

Explore, analyze, plot and contextualize SUS data

Allows you to calculate your SUS study scores for your multi-variable or single-variable usability studies to get instant insights and plots based on years of research on what specific SUS study scores correlate with.

Generate questionnaires before your SUS study

Provides you the utility to quickly generate PDFs based on the SUS questionnaire in 20 different languages and variants and specifies whether a specific variant is peer-reviewed, validated and internally reliable.

Calculate the inferential statistics for your study

Lets you calculate the inferential statistics for your studies hypotheses to answer questions like: Did your usability significantly improve? or Which product has significantly better perceived usability?

Meet the team

Meet our small but dedicated team of developers behind the SUS Analysis Toolkit. You want to join and contribute? Cool!
Check out our current projects and roadmap to see how you can help enhance usability analysis. Or just talk to us!

Picture of Dr. Jonas Blattgerste

Dr. Jonas Blattgerste

Lead Developer & Maintainer

Picture of Prof. Dr. Thies Pfeiffer

Prof. Dr. Thies Pfeiffer

Picture of Jan Bahrends

Jan Behrends

Understanding the System Usability Scale Analysis Toolkit

Frequently Asked Questions

What is the System Usability Scale?

The System Usability Scale (SUS), developed by John Brooke, is the most widely-used questionnaire for measuring perceived usability. It consists of 10 Likert-scale questions, with responses ranging from Strongly disagree to Strongly agree. The results are aggregated into a single score ranging from 0 to 100, known as the SUS score. Multiple SUS scores can be used to represent an overall SUS study score. The SUS is straightforward to administer, has been validated through extensive applications over decades, is easy for participants to understand, is available in multiple languages and variants, and can be applied to any product/system that involves human interaction.

What is the System Usability Scale Analysis Toolkit?

The SUS Analysis Toolkit is an open-source, web-based toolkit designed for the analysis, plotting, interpretation, and contextualization of single- and multivariable System Usability Scale (SUS) usability studies. It offers a comprehensive suite of tools based on insights and contextualization approaches derived from scientific literature. Therefore, we hope it enables researchers and practitioners to effortlessly calculate and visualize comparative, iterative, and single-variable SUS usability study datasets. Additionally, it provides utilities to interpret calculated scores, compare them against scores from meta-analyses, assess the conclusiveness of SUS scores, and analyze the impact of individual questions from the 10-item SUS questionnaire on overall study scores. The toolkit is particularly focused on generating publication-ready scientific figures and calculations for direct use in scientific publications and presentations. Moreover is provides utility to generate SUS questionnaires and also provide the full inferential statistics for iterative or comparative SUS studies.

Can the SUS Analysis Toolkit be integrated with other tools or platforms?

There are currently no automated integrations with other tools available for the SUS Analysis Toolkit due to privacy concerns and the maintenance costs associated with supporting such integrations continuously. However, since the toolkit is open-source, users are encouraged to explore and create their own integrations. If there is enough demand we might consider this in future releases.

Are there any case studies or examples of the SUS Analysis Toolkit in action?

Yes, besides the initial usability study of the first iteration of the toolkit itself (see Blattgerste et al. 2022), there are several scientific publications that have utilized and cited the SUS Analysis Toolkit already. These publications provide insights into how the toolkit has been applied in various research contexts. For those examples, you can explore the citations of the toolkit on Google Scholar.

How is the uploaded data being used? Is uploaded study data stored?

No data is ever stored on our servers beyond the immediate usage of the toolkit, nor is it used for any purpose other than providing the necessary calculations and plots. More precisely, the components pdf.sus.tools (the questionnaire generator) and statistics.sus.tools are purely client-side, meaning they run entirely in your browser without communicating with any server at all. The analysis.sus.tools (or sus.mixality.de, the hosted instance of the analysis component by the Mixality group at the University of Applied Sciences Emden/Leer) operates on a server where data is briefly uploaded to perform the requested calculations and plots. This data is deleted as soon as the session ends. Notably, if this is still a problem for your specific use case, the analysis component can also be run locally on your PC.

How is the SUS Analysis Toolkit funded?

The SUS Analysis Toolkit was originally developed during and for Project Heb@AR and therefore partially funded by the German Ministry for Education and Research (BMBF) through the grant 16DHB3021. The toolkit was further supported by the Mixality group at University of Applied Sciences Emden/Leer, which hosts parts of the toolkit to this day. Since then, the hosting of components is privately funded as a hobby project and receive no further financial support.

How is the SUS Analyis Toolkit licensed? How should it be acknowledged?

All parts of the SUS Analysis Toolkit are licensed under the MIT license and can be used, extended and redistributed for commercial and non-commercial use cases without attribtution. The ownership of generated calculations, interpretations, tables, and plots fully remain with the user of the tool. If you use this toolkit in the scientific context, we would appreciate an acknowledgement in form of a citation to our tool and recommend citing the primary sources for the insights utilized.

Preview image of the tools publication

More information needed?
Read our Publication!

Blattgerste, J., Behrends, J., & Pfeiffer, T. (2022, June). A web-based analysis toolkit for the system usability scale. In Proceedings of the 15th International Conference on PErvasive Technologies Related to Assistive Environments (pp. 237-246).

Google Scholar ACM (Publisher) Download PDF